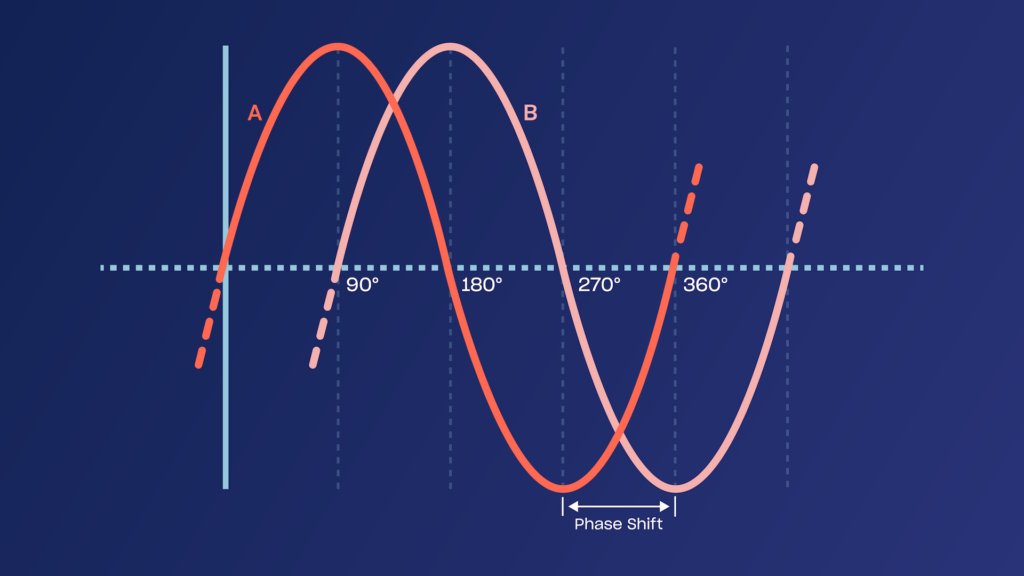
In vibration analysis, three key parameters—amplitude, frequency, and phase—are used to identify machinery issues and determine their severity. Each plays a unique role: amplitude reveals the severity of the problem, frequency identifies the nature of the problem, and phase provides insight into how vibration signals move in relation to one another.
What is Phase Analysis?
Phase analysis is a powerful but often underutilized technique that helps diagnose specific machinery problems, particularly those related to 1X frequency issues such as unbalance and misalignment. It examines how two vibration points on a machine relate to each other at a given frequency. This is typically measured in degrees (0° to 359°) and can provide critical insights into machine behavior.
In order to understand phase analysis, it is first necessary to understand the concept of absolute phase and relative phase:
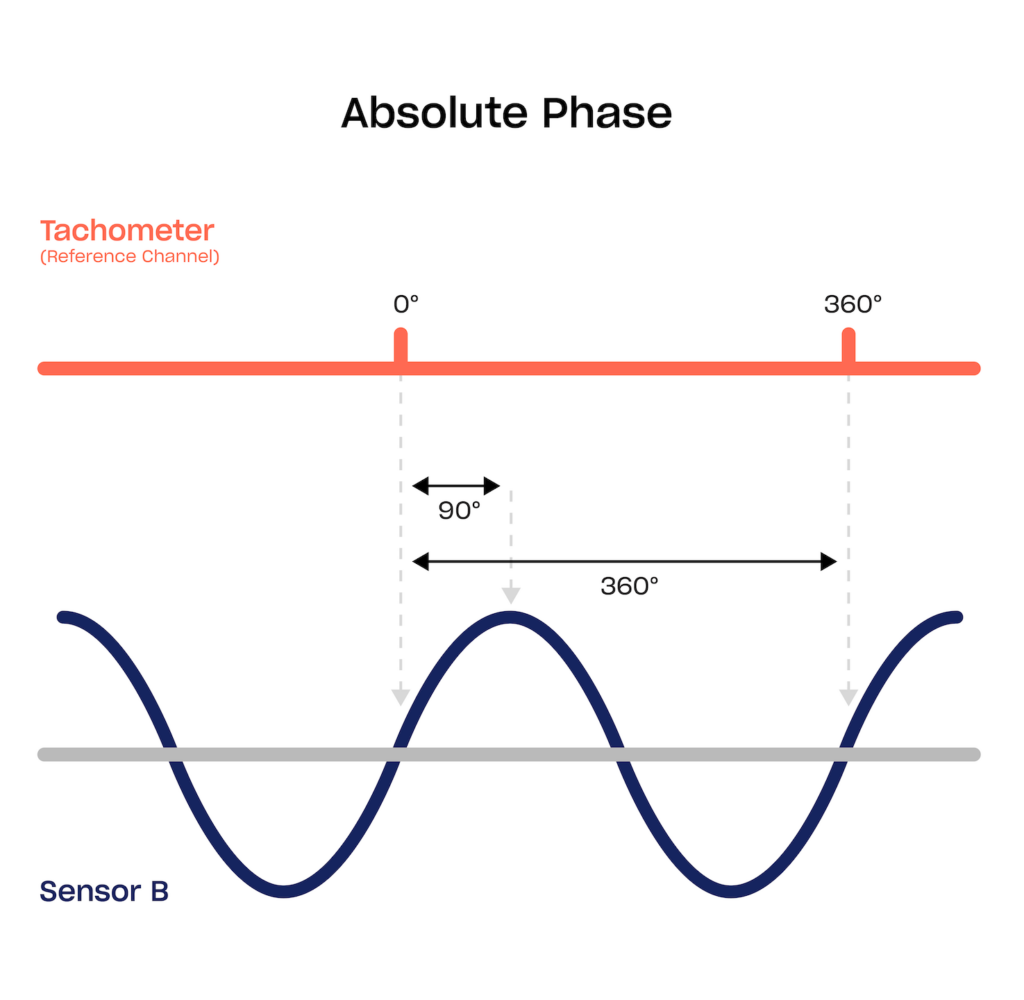
Absolute Phase represents the phase angle of a vibration signal relative to a fixed reference, like time or a machine’s rotational position. While absolute phase provides insights into a machine’s overall dynamics, relative phase is particularly valuable for diagnosing specific relationships between components.
Relative Phase refers to the phase difference between two signals, typically measured between the vibration of two points on a machine or between a vibration signal and a reference signal, such as a tachometer pulse. This measurement helps identify misalignment, looseness, or other mechanical issues by showing how different parts of a system move in relation to each other.
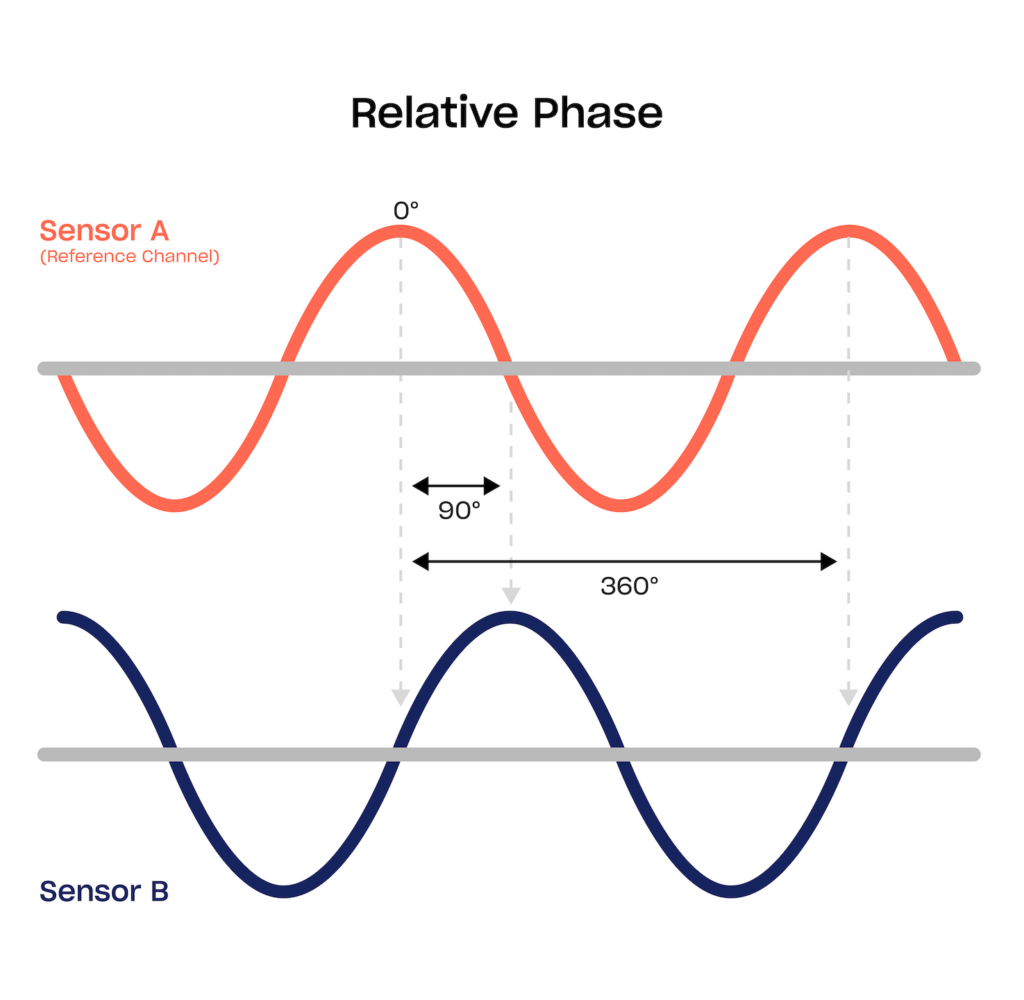
Modern vibration analyzers, like the Acoem Falcon, often include a cross-channel phase function. This type of function will measure relative phase, which helps simplify the process compared to older methods that relied on reflective tape and a tachometer (absolute phase).
How Phase Analysis Works
When utilizing the cross-channel function of a vibration analysis tool, one sensor acts as a reference while another is moved to various points on the machine. The relationship between the phase readings reveals important information about the machine’s condition. Let’s explore a few examples:
Diagnosing a Loose or Cracked Machine Base
If a machine base is solid, phase readings at different points will be similar, indicating the base is moving in sync (“in phase”). Conversely, a loose or cracked base will produce readings approximately 180 degrees out of phase across the defect. This indicates the two sides are moving in opposite directions. Visual aids, such as a simple grid drawing of the base, can help map out the test results and clarify the findings:
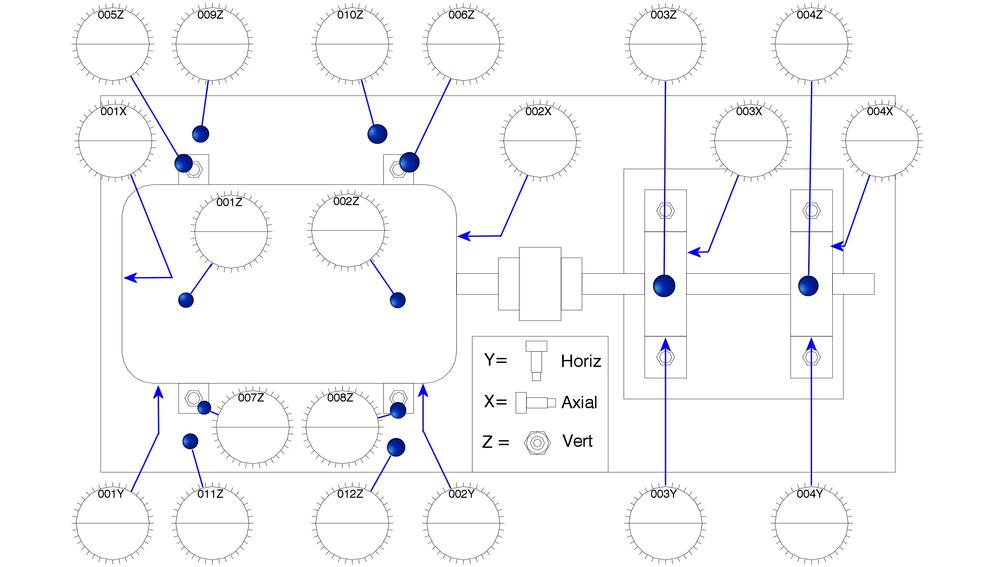
Example of a bubble diagram showing phase and amplitude measurements. Source: https://assetmanagementprofessionals.org/discussion/bubble-chart
Analyzing Coupled Machinery
Phase analysis can also identify misalignment in coupled machines, such as between a motor and a pump. By comparing phase readings in vertical, horizontal, and axial directions, you can determine whether the misalignment is angular, parallel, or caused by unbalance.
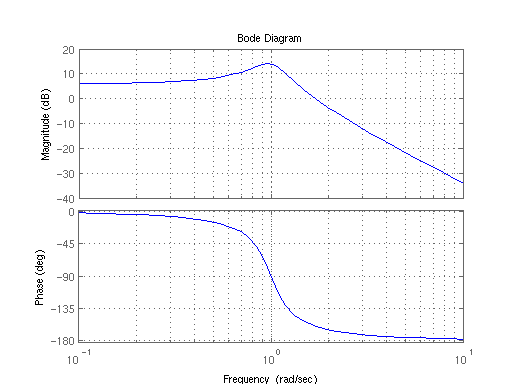
Example of bode plots. Source: https://electronics.stackexchonge.com/questions/160140/what-are-some-insights-from-looking-at-bode-plots
Identifying Critical Speeds and Other Issues
During a run-up or coast-down test, a phase shift of approximately 180 degrees coupled with a spike in amplitude often indicates a critical speed. Similarly, phase analysis can help detect other issues like cocked bearings or bent shafts.
Building Confidence in Vibration Analysis
To improve the accuracy of your phase analysis, make sure you have reliable reference charts and regularly review your vibration data. Accurate phase analysis not only enhances your ability to diagnose machinery problems but also builds confidence in your vibration analysis program. This confidence is key to becoming a skilled and trusted vibration professional. By mastering phase analysis, you’ll be equipped to uncover hidden issues and make informed decisions that keep machinery running smoothly.


