It is important in vibration analysis to know whether the vibration data you are looking at is actually “good data”. Below is a review of the causes and symptoms of junk data, as well as some tips to improve data quality overall in the future.
Reasons for Bad Data
A poor electrical connection is a common cause of bad data. You may think that wireless accelerometers have eliminated that problem – the truth is, they haven’t. The symptom of this type of bad data is in the overall value, the FFT spectrum, and the time waveform. What you will likely see is a significant change in the overall value caused by the ski slope that you would see in the low-frequency range on the FFT spectrum.

This “ski slope” is very typical to see on the FFT spectrum when you are reviewing “bad data”. The time waveform will also show bad data, as it will not have a pattern to it and appear erratic with very high or low amplitudes.
Spectrum During Data Collection
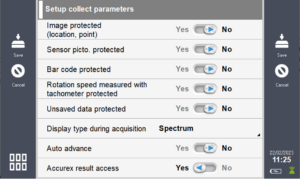
It is always a good idea to set up your Falcon Data Collector to view spectrums while collecting data to watch for this and other faults you may detect during data acquisition. Making this change is simple:

Under settings, choose “Collect”, and then where it says “Display type during acquisition” choose “Spectrum”.
By keeping an eye on the spectrum during data collection, you are more likely to notice anomalies such as what would be caused by a poor connection or a similar fault in the transducer.
If you see a suspect spectrum or an overall vibration value has deviated significantly from its historical or expected amplitudes, retake the reading. All identifiable vibration faults are repeatable and will present themselves regardless of how many times you retake a reading, while bad data caused by a faulty connection is typically less repeatable. If you do this and the amplitude of your overall value is changing significantly between different readings, you are likely experiencing this issue.
Other Sources of Bad Data
Another source of bad data is improperly identified data. This is most often caused by missing a point and continuing to collect data, being on the wrong machine entirely, or having the accelerometer in a different direction than what was listed on the route.

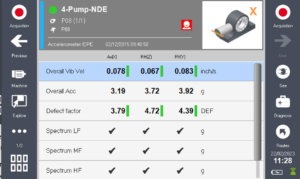
The Falcon Data Collector does a good job of eliminating this type of error by allowing the user to include photographs of the point position and the machine itself. Just remember to include these pictures in your machine setup and use them while you are acquiring data in the field.
Setup and Acquisition Locations
Finally, we will briefly discuss data setup and acquisition locations. These should be included in any discussion regarding bad data because the data you are getting isn’t obviously bad and can be more misleading than a weak connection.
Data setup errors that cause bad data are usually issues where the FFT or overall value doesn’t collect out to a high enough bandwidth to capture the fault. If you are trying to identify gear mesh with a 60k bandwidth overall bandwidth, you are likely not going to see it. Rendering that data point is useless assuming the setup wasn’t intended to remove that variable. The Accurex setups are good to provide useful overall values across a very wide frequency range and should keep you from having this issue.
Data collection acquisition locations can be viewed as bad data. If you are too far away from the bearing to get any meaningful high-frequency data, you will not be able to have early detection on a bearing fault or low lubrication issue. If you are really far away, you will be caught off guard entirely and machinery issues will go completely unidentified while providing everyone interested in the vibration data results to have a false sense of confidence.


1 Comments
I belive you have to show the overall vibration value beside the spectrum for better onside assessment